
Ayer By The Numbers
Town of Ayer by the Numbers
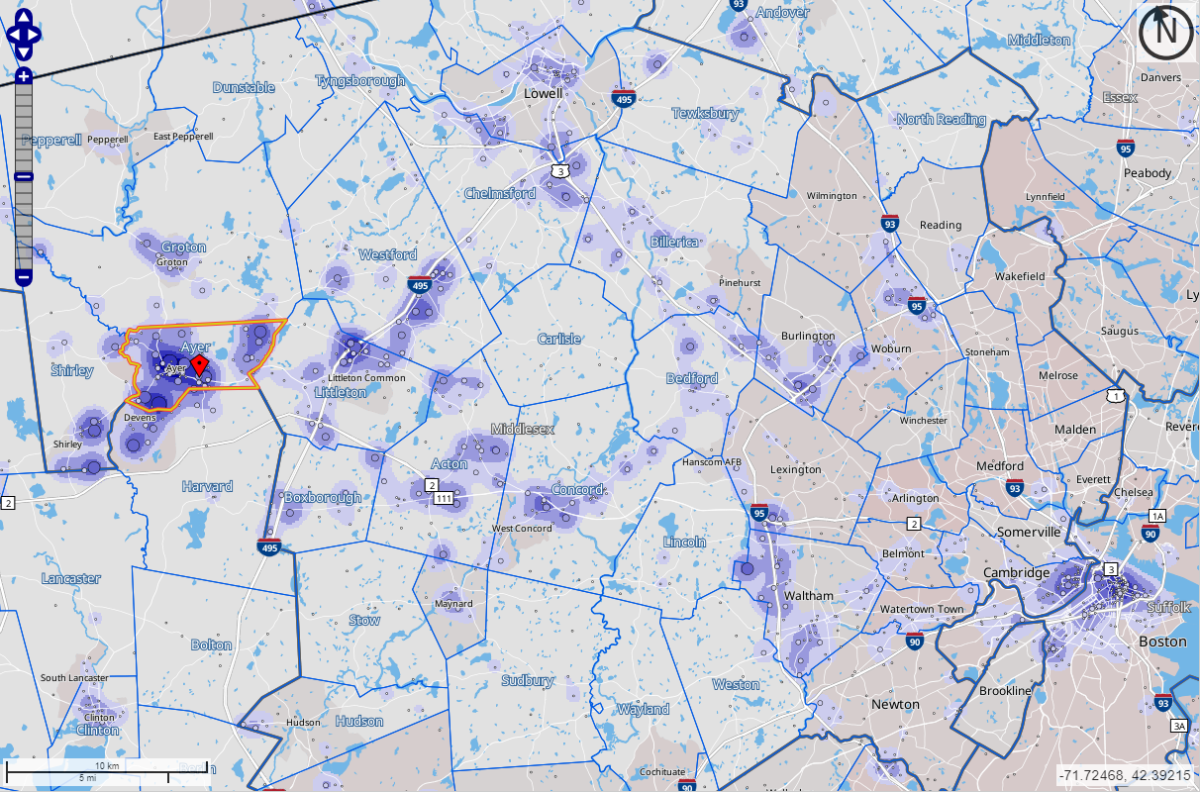
Town of Ayer MA/Middlesex County
Selected Demographic Data
Source: US Census (2020)
Source: US Census (2022 Estimates)
Prepared by Ayer Office of Community & Economic Development (AOCED)
Population: | 8,424 (July 2022) |
Total # of Households: | 3,694 |
Persons Per Household: | 2.25 |
Median Household Income: | $101,688 |
Per Capita Income: | $51,578 |
Population Per Sq. Mile: | 947.5 |
Householders Living Alone: | 36.50% |
Owner-Occupied Housing Units: | 69.00% |
Renter-Occupied Housing Units: | 31.00% |
Persons Living in Poverty: | 5.90% |
Total in Civilian Workforce: | 76.00% |
Persons Aged 65 & Over: | 14.80% |
(Race) White alone: | 82.20% |
(Race) Hispanic or Latino: | 9.80% |
(Race) Asian alone: | 4.90% |
(Race) Black alone: | 2.50% |
(Race) Two or more races: | 5.30% |
High School Graduate: | 92.90% |
Bachelor’s Degree or Higher: | 45.50% |
Persons with Disabilities: | 11.10% |
Military Veterans: | 7.20% |
Town of Ayer Daily Inflow/Outflow of Workers
- 4,907 persons are employed by companies in the Town of Ayer (private & public sectors inclusive).
- 4,586 persons working daily in the Town of Ayer live outside of Ayer (93.4%)
- 3,685 of the total 8,400 residents of the Town of Ayer are currently working/employed (43.8%)
- 321 persons working daily in the Town of Ayer are residents of Ayer (8.7%)
- 3,364 of the total 3,685 residents leave Ayer each day to work in another community (91.2%)
(Source: US Census Longitudinal Employment Dynamics LED On The Map)
Where Those Employed/Working in Ayer Live (All Jobs):
| Leominster, MA | 483 | 8.3% |
| Fitchburg, MA | 467 | 8.0% |
| Lowell, MA | 265 | 4.5% |
| Ayer CDP, MA | 167 | 2.9% |
| Worcester, MA | 152 | 2.6% |
| Gardner, MA | 128 | 2.2% |
| Nashua, NH | 127 | 2.2% |
| Lawrence, MA | 55 | 0.9% |
| Clinton CDP, MA50 | 53 | 0.9% |
| Shirley CDP, MA | 50 | 0.9% |
| All Other Locations | 3,899 | 66.7% |
(Source: US Census Longitudinal Employment Dynamics LED On The Map)
Daily Commuting Distance for Ayer Residents
Total All Jobs | 4,549 | 100% |
Less than 10 miles | 1,400 | 30.8% |
10 to 24 miles | 2,044 | 44.9% |
25 to 50 miles | 880 | 19.3% |
Greater than 50 miles | 225 | 4.9% |
(Source: US Census Longitudinal Employment Dynamics LED On The Map)
Daily Workplace Destination for Ayer Resident
Boston | MA | 299 | 6.6% |
Ayer CDP | MA | 184 | 4.0% |
Waltham | MA | 144 | 3.2% |
Devens | MA | 142 | 3.1% |
Worcester | MA | 131 | 2.9% |
Lowell | MA | 112 | 2.5% |
Marlborough | MA | 106 | 2.3% |
Leominster | MA | 99 | 2.2% |
Burlington | MA | 98 | 2.2% |
Cambridge | MA | 95 | 2.1% |
All Other Locations |
| 3,139 | 66.7% |
(Source: US Census Longitudinal Employment Dynamics LED On The Map)
- Massachusetts Job Openings and Labor Turnover — January 2024 (Source: US Bureau of Labor Statistics)
- Average Energy Prices, Boston-Cambridge-Newton — February 2024 (Source: US Bureau of Labor Statistics)
- Consumer Price Index, Northeast Region – February 2024 (Source: US Bureau of Labor Statistics)
- Motor Fuel State Tax Rate (US Dept. of Transportation – Bureau of Transportation Statistics)